
Maple producers know that sap flow is very dependent on air temperature. But other environmental factors matter, too. To try to understand the intricate relationships between temperature, pressure, moisture, and sap flow rate, the Cornell Maple Program is conducting a scientific study at six sugarbushes—and you can see the measurements in real time throughout the season on a public dashboard.
The Wisconsin Extension Maple Program is partnering with Cornell to host one of the sap flow and environmental monitoring systems at Scott Walter’s farm in Viola, Wisconsin. Scott is a commercial maple producer running about 4,000 taps this year.
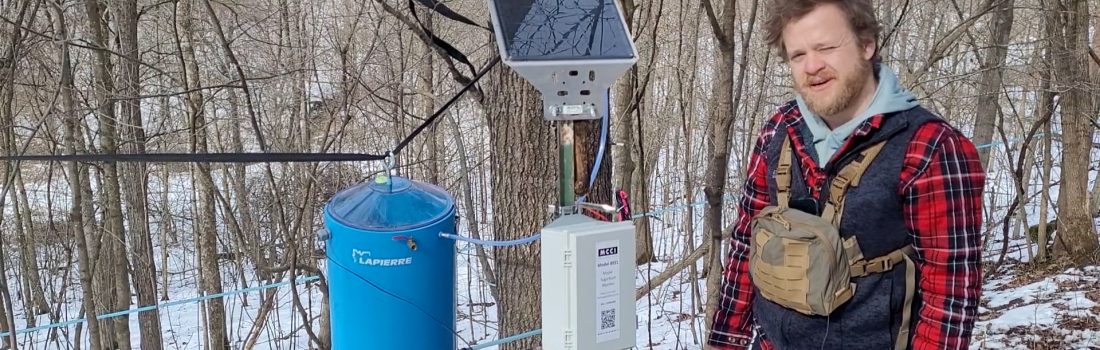
Check out the video below for a behind-the-scenes tour of the monitoring system at Driftless Gold and then visit the dashboard to see what conditions are like today.
In each sugarbush, sensors are set up at one tree to collect data on:
- Sap flow rate
- Rainfall rate
- Tree pressure
- Air pressure
- Air temperature
- Relative humidity
- Soil moisture (in two locations)
- Soil temperature (in two locations)
- Tree temperature (in two locations).

Adam Wild, Senior Extension Associate and Director of the Uihlein Maple Research Forest with the Cornell Maple Program, joined the Maple Hour to discuss the science of maple sap flow. He explained the factors impacting sap flow and an innovative research project aimed at better understanding the process. You can watch the recording here:
We hope you’re having a great maple season!